FPE Index — how much pump prices have moved in Europe
An index measures movement, not level: January 5, 2026 = 100. The daily series is built from per-station prices in 8 European markets; before that it is weekly, from the European Commission bulletin, back to 2005.
Diesel and petrol 95 at the pump, taxes included. National sub-indices are measured in the local currency, which is what the driver there feels. The European aggregate is in euro: Romania’s contribution is converted with the ECB rate of the day.
The last 90 days
Three charts: the level of the FPE index, its daily percentage change, and the regional sub-indices, over the last 90 days.
| Regional sub-indices | Index | 7 days | 30 days | Base | Market |
|---|---|---|---|---|---|
| Western Mediterranean | 119.8 | +1.97 % | +4.13 % | June 27, 2026 | Spain, France, Italy |
| Balkans | 100.4 | +3.15 % | +6.45 % | August 6, 2026 | Croatia, Romania, Slovenia |
FPE Diesel · Diesel and petrol 95 at the pump, taxes included.
The markets in the index
| Market | Index | Price | 7 days | Stations | Weight | Base |
|---|---|---|---|---|---|---|
| France | 121.7 | 2.320 €/L | +1.56 % | 9,912 | 31.9 % | June 26, 2026 |
| Italy | 115.0 | 2.224 €/L | +1.73 % | 22,066 | 26.2 % | June 26, 2026 |
| Spain | 122.0 | 1.847 €/L | +2.79 % | 12,037 | 23.6 % | June 26, 2026 |
| Romania | 111.0 | 2.009 €/L | +3.60 % | 1,140 | 6.4 % | May 21, 2026 |
| Austria | 107.6 | 2.135 €/L | +2.72 % | 2,249 | 5.6 % | August 12, 2026 |
| Denmark | 119.9 | 2.558 €/L | +4.40 % | 2,092 | 2.5 % | July 14, 2026 |
| Croatia ★ | 104.9 | 1.849 €/L | +2.88 % | 863 | 2.2 % | August 5, 2026 |
| Slovenia ★ | 105.8 | 2.001 €/L | +2.68 % | 543 | 1.6 % | August 5, 2026 |
FPE Diesel · Data for September 15, 2026 · daily series · Diesel and petrol 95 at the pump, taxes included.
★ Prices regulated by the state and reset about every two weeks. The sub-index stands still, then jumps — that is the market, not a bug.
Computed, but not published
These markets are calculated with the same formula and kept out of the published aggregate. The reason is next to each one.
- Portugal — source licence forbids commercial use
source (DGEG) forbids commercial use; awaiting written authorisation - Andorra — source licence forbids commercial use
source reserves all rights; no Eurostat consumption weight - Lithuania — source artefact under investigation
source publishes a different figure on Tuesdays (+3.3%/day vs -1.3% the rest of the week) - Iceland — series break in the source
source series breaks on 1 Sep 2026: all 245 stations and both fuels jump by exactly +11.67% in one day - United Kingdom — panel too short yet
panel complete only since 7 Sep 2026; joins automatically at 30 days - Iberia — waiting for a second published market
fewer than 2 published markets: PT (source (DGEG) forbids commercial use; awaiting written authorisation) - Nordic — waiting for a second published market
fewer than 2 published markets: IS (source series breaks on 1 Sep 2026: all 245 stations and both fuels jump by exactly +11.67% in one day) - Central Europe — waiting for a second published market
fewer than 2 published markets: CZ (no series); SK (no series); HU (no series); PL (no series)
Methodology
The formula
For every pair of consecutive panel days, the change is the mean of the log price relatives, computed only on the stations that have a valid price on BOTH days (a matched sample). The index is then chained: Index(t) = Index(t−1) × L(t). If three thousand cheap stations join the panel tomorrow, the index does not move — they have no yesterday to be compared with, and they contribute only through their own change, from their second day on. The same holds for a whole market joining.
The weights
Final energy consumption in road transport, Eurostat nrg_cb_oil (FC‑TRA‑ROAD‑E), 2024. Not station counts: Italy has 40% of the stations in our panel but sells 24.5% of its diesel. Stations measure how dense a network is, not what Europe actually buys.
Currency
National sub-indices are measured in the local currency, which is what the driver there feels. The European aggregate is in euro: Romania’s contribution is converted with the ECB rate of the day.
The history
The daily series starts on June 27, 2026. Before it, the index is weekly, built with the same formula and the same weights from the European Commission Weekly Oil Bulletin — all 27 member states, back to 3 January 2005. The two are spliced at the junction by matching the level. What nobody measured is the move between the last bulletin week and the first panel day; the splice puts it at zero, and the composition differs on either side (27 countries weekly, 8 markets daily).
The thresholds
- A day enters the chain only if the panel has at least 90% of that market’s maximum station count.
- A link needs at least 25 matched stations and at least 50% of the smaller of the two panels.
- A single-station move of 49% or more is dropped as a scraping error.
- More than 7 days without data breaks the chain; only the last unbroken segment is published.
- The aggregate starts on the first day the markets present cover at least 50% of the total weight.
No revisions
A day is computed from the data of that day and the day before, and stays as published. Gaps are not smoothed backwards — that would change yesterday’s value today, which is exactly what a cited series must never do. Changes of methodology are announced in the log at the bottom of this page.
What stops a day from being published
Before publication, a check blocks the day if one market moves more than 4% in a day, if fewer than 6 of the published markets are fresh, or if the fresh markets cover less than 80% of the weight. A blocked day leaves the previous day on the page, with its own correct date.
Validation
Against the European Commission Weekly Oil Bulletin, on the same composition of countries and eleven overlapping weeks: diesel −0.20 ± 0.80 index points, petrol +0.55 ± 0.41. Two entirely independent collections tell the same story. Measured against the full EU‑27 bulletin instead, diesel differs by −2.77 points — that gap is real information: the markets we do not cover moved differently from ours.
Limits, stated plainly
- The daily series covers 51% of EU‑27 road diesel consumption, not all of it. Germany, Poland and the Netherlands are not in it.
- This is a price index, not a price. It says how much prices moved, not what a litre costs; the average litre price is shown next to it for that.
- Slovenia and Croatia have state-regulated prices reset about every two weeks. Their sub-indices stand still and then jump.
- The weekly backbone before June 27, 2026 and the daily series after it have different compositions. The level is spliced; the two halves are not the same measurement.
How to cite
The index series is published under CC BY 4.0. That covers this series — a derived statistic of our own making — not the underlying source data, whose licences are listed below.
Suggested citation:
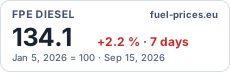
FPE Diesel: 134.1 (January 5, 2026 = 100). fuel-prices.eu, September 15, 2026. CC BY 4.0.
https://www.fuel-prices.eu/fuel-price-index/
Embed the badge
A small SVG, refreshed daily. It is an image, not a script: no code runs, no cookie is set, and it passes any newsroom content policy.
<a href="https://www.fuel-prices.eu/fuel-price-index/">
<img src="https://www.fuel-prices.eu/fuel-price-index/badge.svg?fuel=diesel&lang=en"
alt="FPE Diesel" width="230" height="72" loading="lazy">
</a>
Download the series
Full series (CSV) Full series (JSON) Markdown
One row per date, from 2005 to today, with a column telling you whether that row is weekly or daily.
Questions
Is this an official index?
No. It is published by fuel-prices.eu and is not a publication of the European Commission or of any national authority. It is a derived statistic: we reweight and reindex public data, and we say so wherever it appears.
Why does the index differ from the EU bulletin?
Mostly composition. On the same set of countries the two agree to within a fifth of an index point. Across the full EU‑27 the bulletin includes markets we do not measure daily, and those markets moved differently.
Does a past value ever change?
No. A published day is final. If we ever change the method, the change is announced in the revision log and applies from a stated date.
Why January 5, 2026 = 100?
Because 1 January 2026 is not a bulletin date — January 5, 2026 is the closest one. A base at the start of a calendar year makes the year-to-date figure readable without arithmetic.
Revision log
- September 16, 2026 — First publication. Daily series from 27 June 2026, weekly backbone from 3 January 2005, base 5 January 2026 = 100.
Sources
Not an official index. fuel-prices.eu is not a public authority; this is a derived statistic based on the sources listed below, reweighted and reindexed by us.
- FR — Prix des carburants — data.economie.gouv.fr · Licence Ouverte 2.0 (Etalab)
- IT — Prezzi carburanti — MIMIT · IODL 2.0
- ES — Precios de carburantes — MINETUR/Geoportal · RD 1495/2011
- HR — Cijene goriva — MINGOR · Otvoreni podaci
- SI — goriva.si
- AT — Spritpreisrechner — E-Control
- DK — Danish retail chain list prices
- RO — Monitorul Preturilor (ANRE) + fuel-prices.eu
- EU — EU Weekly Oil Bulletin — European Commission, DG ENER · CC BY 4.0 (Decision 2011/833/EU)